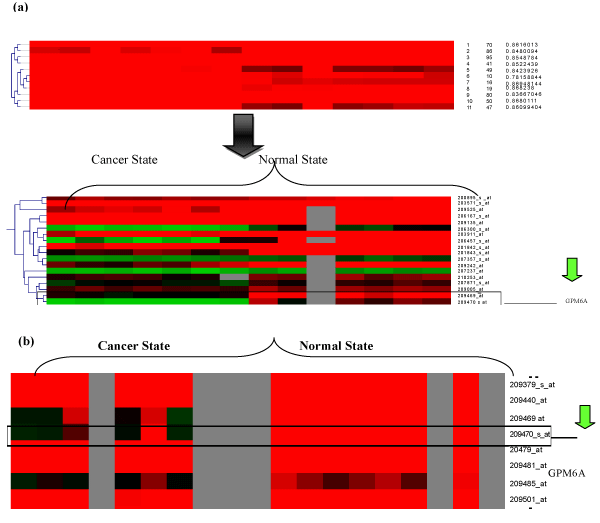
Figure 5:
Self Organizing Tree Algorithm diagrams of the two datasets (a) GDS1732 (b) GDS1665. Red color indicates the highly expressed genes, Green color shows down regulating genes in the datasets