|
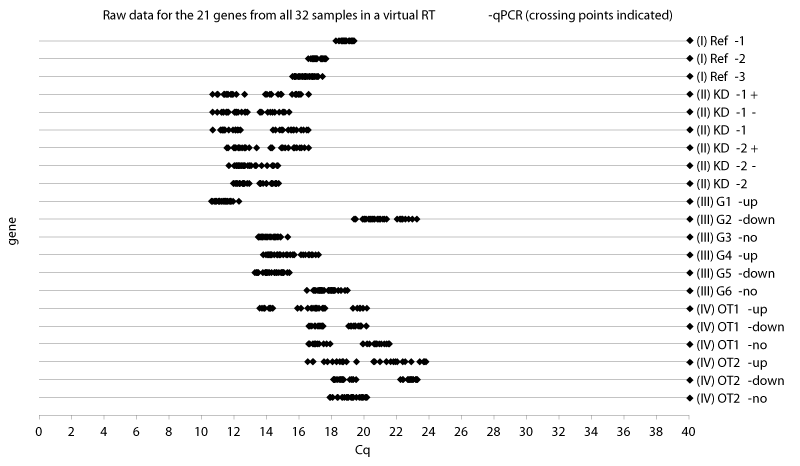
| Figure 1: Cq-values plotted as virtual RT-qPCR. The one random output of our simulation which underlies all graphs in this work represents a raw dataset from a RT-qPCR gene expression analysis of 21 genes. The 32 Cq-values (originating from the eight different application combinations multiplied by the four replicates) are plotted gene wise on a line, like fluorescence-signals crossing a threshold in an in vitro RT-qPCR reaction. The random data distribution and within the emulated CV-value gets visible best in class I genes (unregulated reference-genes). Particular regulation effects become apparent by the separate clusters among the 32 data points of a gene. |