 |
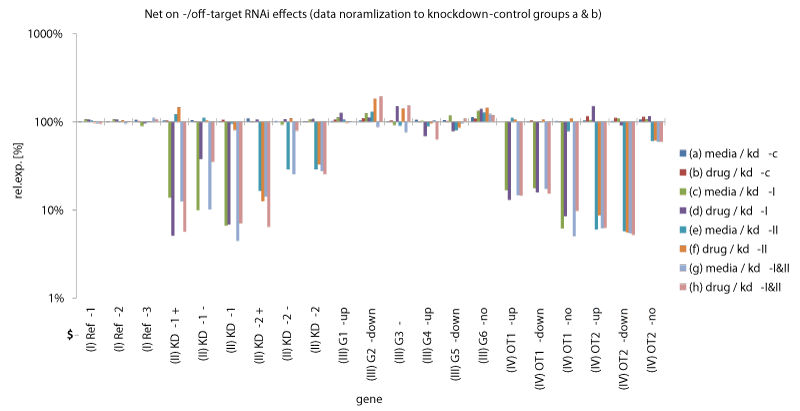
| Figure 2: Knockdown-evaluation from the in silico data set. Relative expression levels of simulated genes after knockdown and/or drug appliance calculated by the ΔΔCq-method plotted against a logarithmic ordinate. Net knockdown-effects are exposed by normalizing data to knockdown control samples. The 21 genes are arranged in four classes: (class I) reference genes (Ref-1, Ref-2, Ref-3); (class II) knockdown-targets (KD-1+, KD-1-, KD-1, KD-2+, KD-2-, KD-2); (class III) drug targets (G1-up, G2-down, G3-no, G4-up, G5-down, G6-no); (class IV) drug targets with an additional off-target effect (OT1-up, OT1-down, OT1-no, OT2-up, OT2- down, OT2-no). The additional prefix specification “+” or “-“ indicated at class II genes stands for an additional synergetic gene regulation effect which occurs when knockdown appliance is combined with drug appliance. The additional prefix specification “-up”, “-down” or “-no” indicated at class III and IV genes stands for the direction of the predestinated gene regulation. For every gene eight expression levels are given corresponding to the eight treatment groups: a - h (Table 1). |