 |
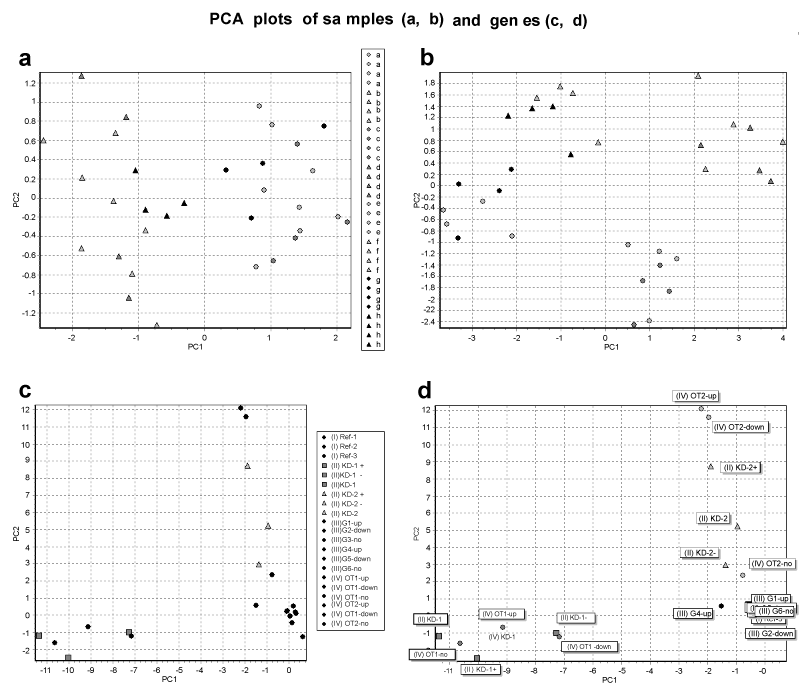
| Figure 4: PCAs of the in silico data set from Figures 1,2 and 3. (a) PCA of all 32 samples (columns = genes, rows = samples) embracing exclusively genes of classes I and III. The samples cluster in two clouds according to media control (circles) or drug treatment (triangles). (b) PCA from the same data pool as in Figure 4a but including the class IV gene OT2-up. The incorporation of OT2-up divides the two clouds from Figure 4a by separating the samples which bear the off-target effect. (c) PCA with data transposed columns by rows including the complete dataset (32 samples x 21 genes). Genes of class II are indicated as squares (kd-I) or triangles (kd-II). Circles indicate genes from the three remaining classes. (d) Plot Identical with Figure 4c, but layout adjusted: gene names are given and class IV genes (with off-target effect) are now labeled in color according to the knockdown they originate from. |