 |
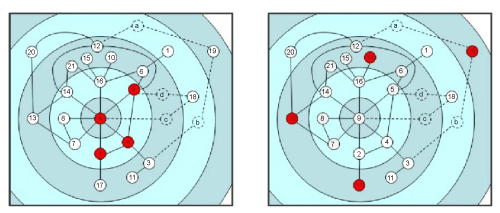
| Figure 3: Graphic representation of the haplotype network of Mal de Rio Cuarto virus (MRCV) according to the distances in Table 2 in two different environments. The arcs drawn in solid lines indicate distance = 1 between connected haplotypes. The concentric circles in the background represent the distance between the nodes contained and the core haplotype, where each circle from the center increases one unit of distance. The same network is shown for two different environments, where the nodes painted indicate the haplotypes present in each environment. |