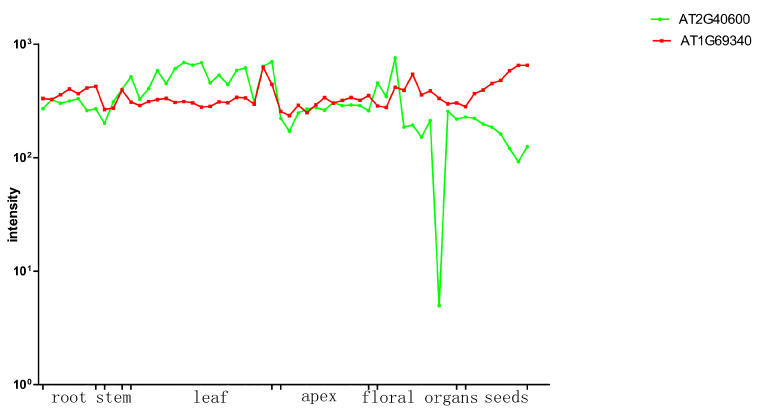
Figure 5:
The expression pattern of
AT1G69340, AT2G40600
in different tissues in Col-0. We got the expression data from AtGenExpress database, and used software R 2.12.0 to make the expression profile.