 |
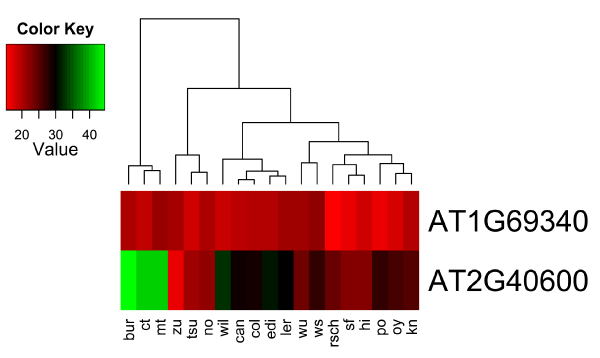
| Figure 6: The expression pattern of AT1G69340, AT2G40600 in 19 ecotypes during seedling stage. All the data were from the web site (http://mus.well.ox.ac.uk/19genomes) (all data was normalized by RPKM (Reads Per Kilobase per Million mapped reads)). “The color scale corresponds to the mean expression of a gene. Red represents low expression, while green represents high expression.” |