 |
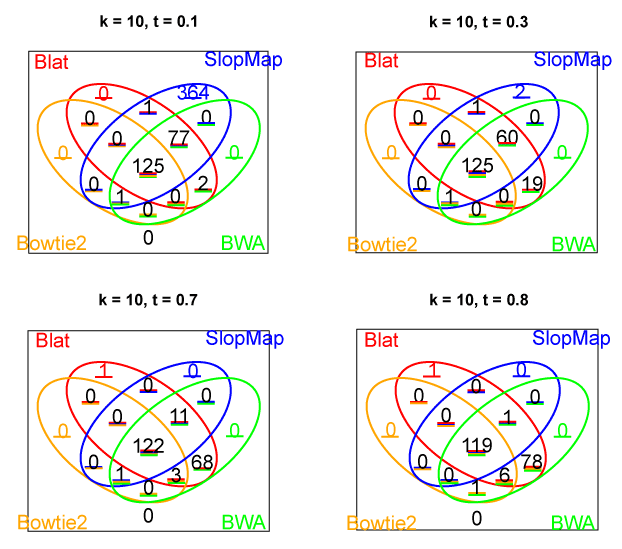
| Figure 5: Number of reads reported by SlopMap and other tools depending on threshold values t and kmer sizes k=10 bases. When t=0.3 (the top-right figure), only 19 reads reported by Blat do not overlap with SlopMap, and those are also reported by BWA; reads reported by BWA and Bowtie2 are subsets of reads reported by SlopMap until t ≥ 0.7. These tests were conducted on Roche 454 E. coli K12 W583 DNA library used as a query set. |