|
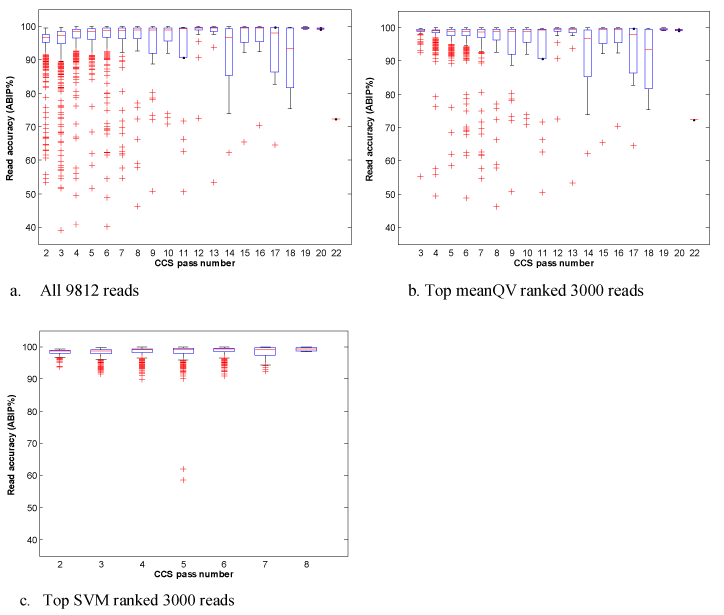
| Figure 4: Box plots of CCS read accuracy (ABIP) for different pass numbers. Figure 4a) shows the box plots for all 9812 reads without doing QC, most of the outliers denoted by red crosses are low-quality reads; Figure 4b) shows the box plots for the top 3000 reads ranked by mean QV. The lowquality reads for pass numbers lower than 7 have significantly been removed but none of those with pass numbers greater than 7 have been removed, meanwhile, no reads with a pass number of 2 have been selected and most good reads for low pass number have also been screened out with the high mean QV threshold. Figure 4c) Shows the box plots for the top 3000 reads ranked by the predicted accuracy value by SVM. Obviously, most of the low-quality reads have been cleaned and all of the reads selected are those with pass numbers less than 9. The two figures 4b) and 4c) illustrate the different effects of the two QC methods due to different ranking mechanisms. |