 |
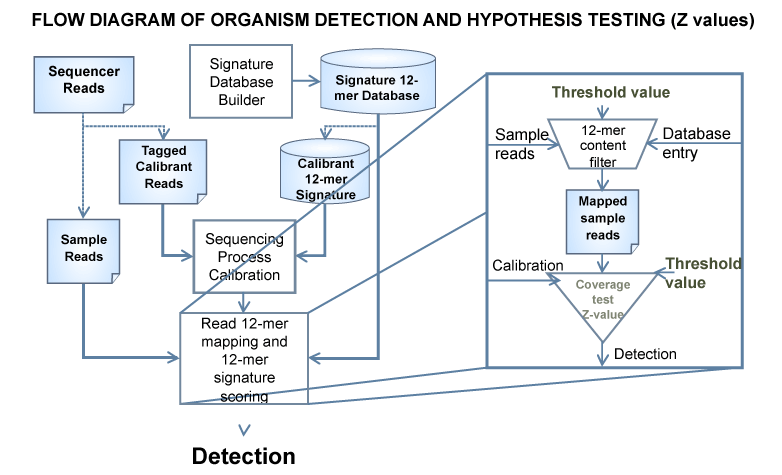
| Figure 1: Process flow for detecting constituent organisms in a test sample using a “noise” calibration, n-mer read filtering to deconvolve a mixture, and a hypothesis test (Z-value). The hypothesis test measures deviation of the observed matching rate of n-mers data against a reference genome’s n-mers, and compares it to the mean deviation of a known organism (calibrant) against its reference when sequenced in same run. The Z value is the deviation expressed in terms of standard deviations of measurements for the calibrant. |