 |
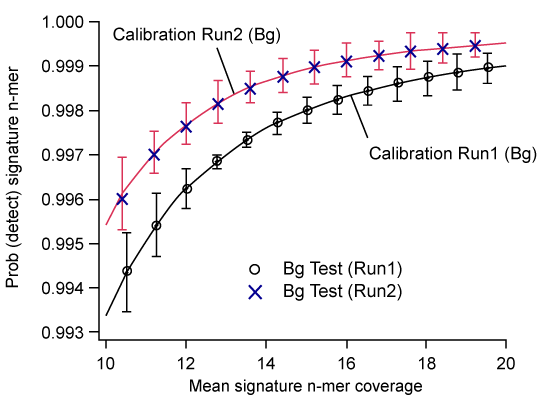
| Figure 2: Calibration curves plotting the mean signature n-mer coverage of the reference genome (Bg strain) versus probability of detecting n-mers for two different Illumina runs. The errors represent the upper 95% confidence interval of the standard deviation for the triplicate measurements for each data point. Test measurement of a separate preparation of the Bg calibrant run in a separate flow cell lane of each run is indicated by the circle (Run 1) and X (Run 2). Note the calibration captures the noise conditions in each run with high precision, and that the curves are not identical between runs. |