 |
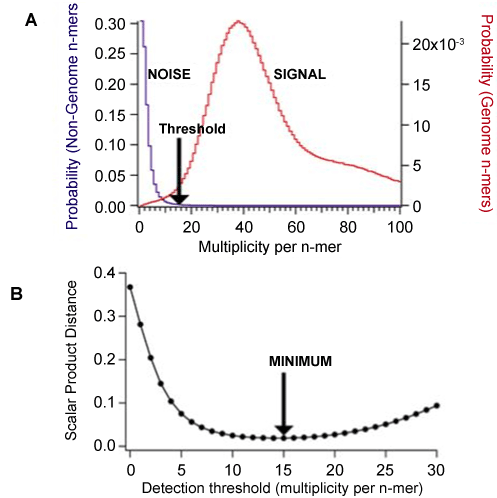
| Figure 7: A) Distributions showing the probability of observing a specific multiplicity per signature n-mer across a reference genome and probability of observing a non-signature n-mer when processing NGS reads. B) Curve showing that the scalar product measure (defined in the text) has a minimum when a specific genomic content detection threshold is used. |