 |
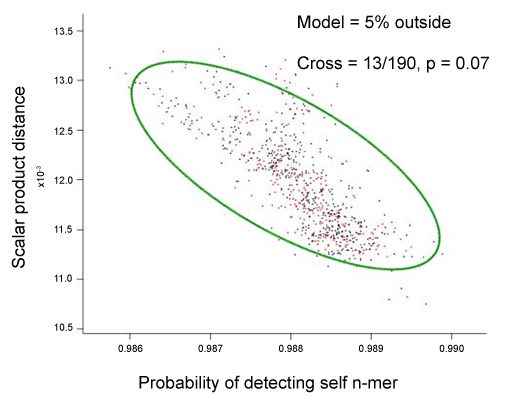
| Figure 8: Plot showing scatter distribution of the scalar product metrics versus its numerator (probability of detecting self n-mer) for genomereference- free comparisons of identical (statistically) read sets from the same sample (red) and between two identical samples of the same organism prepared separately, but sequenced in the same run (blue). The model in green is derived from scatter of self-versus-self points and is used to compute a p-value for observing measured fraction of test points outside the ellipse. In this case, the separately prepared, but identical organism sample gave an insignificant p-value, indicated that the samples are consistent with being identical in genomic content. |