 |
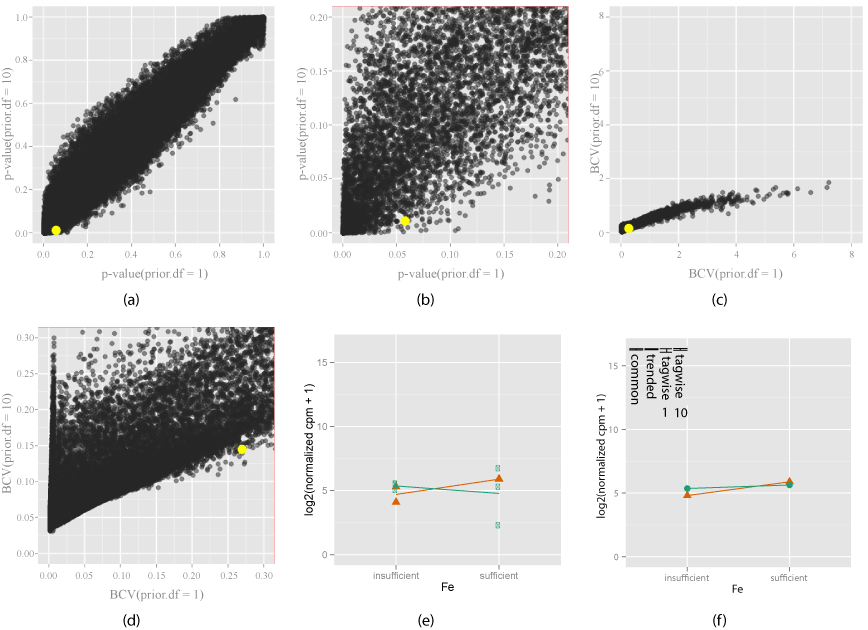
| Figure 6: Exploring how the shrinkage parameter (prior.df) choice a_ects the di_erential expression of EV (orange) when gene signi_cantly di_erentially expressed only with prior.df = 10. Two di_erent shrinkage values (prior.df = 1 and prior.df = 10) are chosen, and compared using the change in p-values (6(a)) and zoomed view (6(b)), BCV (6(c)) and zoomed view (6(d)). Yellow indicates gene under investigation, chosen by mouse action on the plot. The interaction plot (6(e)) for this gene, and the model estimates are shown (6(f)). Bars in the model estimates plot (6(f)) show the changes in di_erent dispersion estimates, for tagwise estimates, number means prior. df. The gene investigated here becomes more signi_cant from the _rst shrinkage value (1) to the second (10), as seen that it has a larger p-value on the horizontal axis (> 0:05) and smaller on the vertical axis (< 0:02) (6(b)), and the decrease in tagwise dispersion (6(f)) with prior.df = 10. It makes sense because the smoothed trended dispersion for this gene is smaller (6(f)) than observed raw dispersion (6(e)). Shrinkage increases the inuence of the global smoothed dispersion on the EV dispersion estimate. |