|
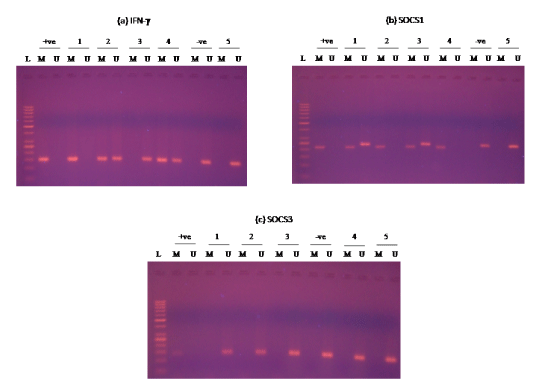
| Figure 1: Representative data showing the methylation status of IFN-γ, SOCS1 and SOCS3 genes promoter. U unmethylated DNA, M methylated DNA, L 50 bp DNA ladder, +ve: positive control (universal methylated DNA), -ve: negative control (universal unmethylated DNA). (a) IFN-γ promoter was totally methylated in samples 1, partially methylated in samples 2 and 4 but totally unmethylated in sample3 and 5. Methylated PCR products are shown as a 151-bp band in Lane M, whereas unmethylated PCR products are shown as a 154-bp band in Lane U (b) SOCS1 promoter was totally methylated in samples 2 and 4, partially methylated in samples 1 and 3 but totally unmethylated in sample 5. Methylated PCR products are shown as a 218 bp band in Lane M, whereas unmethylated PCR products are shown as a 243bp band in Lane U (c) SOCS3 promoter was fully unmethylated in all samples. Methylated PCR products are shown as a 142 bp band in Lane M, whereas unmethylated PCR products are shown as a 151bp band in Lane U. |