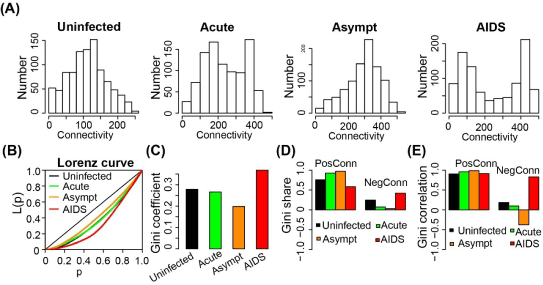
(A) The connectivity distributions of GCNs for uninfected subjects and patients at different stages of HIV-1 infection.
(B) The Lorenz curves of connectivity distributionin four GCNs. prepresents the cumulative fraction of the number of genes in the network, L(p) denotes the
cumulative fraction of connectivity from these genes.
(C) Gini coefficient of connectivity infour GCNs.
(D) Gini share of positive and negative connectivity in four GCNs.
(E) Gini correlation of positive and negative connectivity infour GCNs.