 |
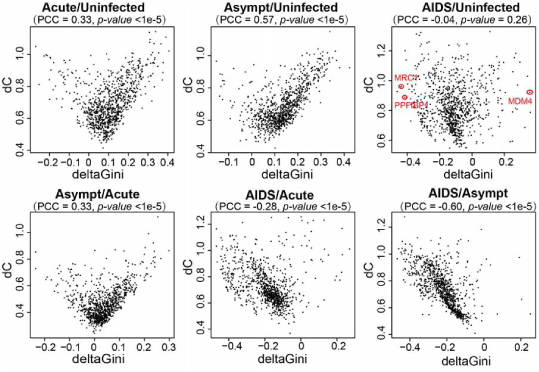
| Figure 3: The dot plots of delta Gin iand dC for comparing GCNs of HIV-1 infection. Each dot represents a gene.“PCC” denotes the Pearson correlation coefficient. The p-value of PCC was calculated using the “cor.test” function in R programming language. |