 |
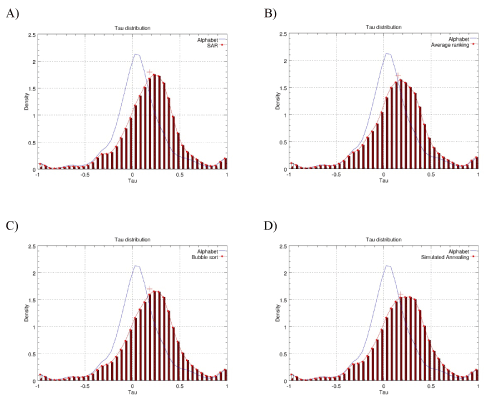
| Figure 1: Histograms of the Kendall tau correlation coefficients between the ranking vectors and vectors of gene lengths of individual COGs obtained using the input matrix of size 100×5664. The blue lines show histograms of the Kendall tau correlation coefficients between a random ranking (using the alphabetic order of the 100 bacteria names as a random control) and individual COGs. In red the histograms of τ’s obtained by various ranking methods are shown: A) Simple Additive ranking B) Average ranking C) Bubble Sort, and D) Simulated Annealing. The red + shows the average value of Tau in the various methods. |