|
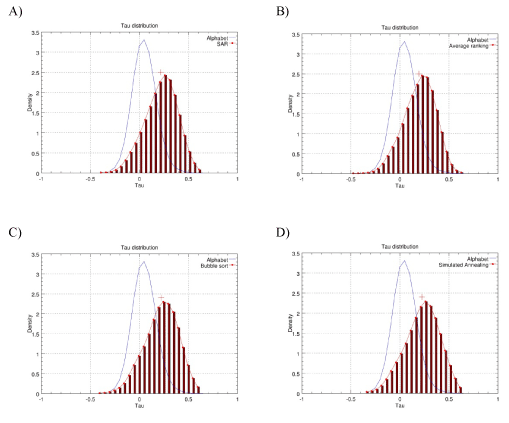
| Figure 2: Histograms of the Kendall tau correlation coefficients between the ranking vectors and vectors of gene lengths of individual COGs obtained using the input matrix of size 100×1455 (Filtered version: excluding columns that contain more than 65% null values). Usage of colors, line and bar graphs is as in Figure 1. The red + shows the average value of the distributions obtained by the various methods. |