|
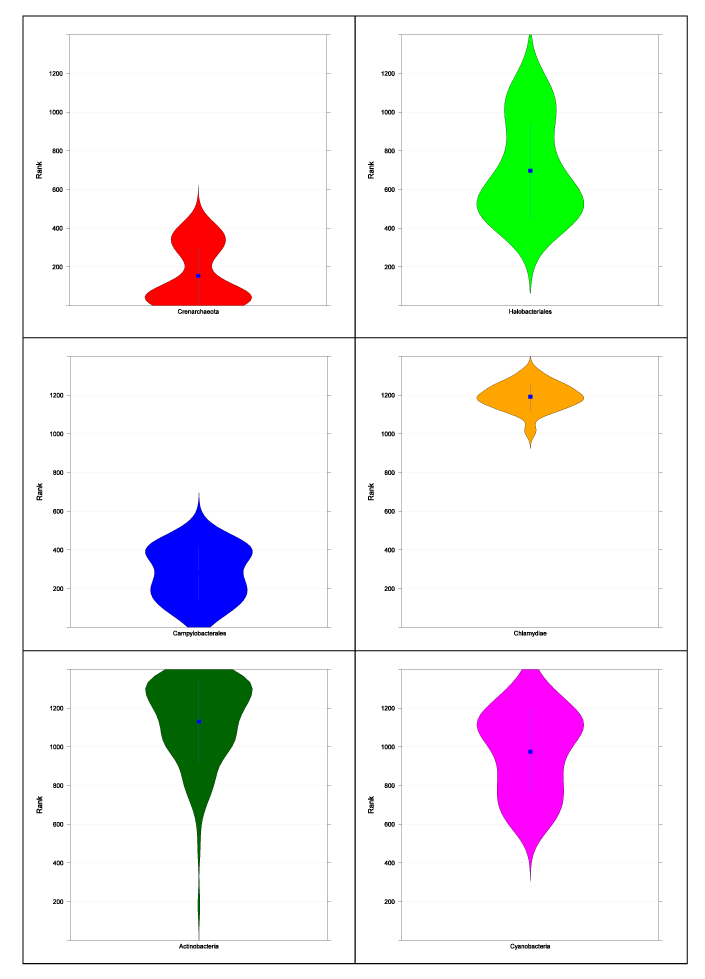
| Figure 3: Violin plots of length distributions for six groups of prokaryotic genomes. Ranks calculated by applying Bubble sort to the filtered set of 1390 prokaryotic genomes. Top: Crenarchaeota (left), Halobacteriales (right) Middle: Campylobacterales (left), Chlamydiae (right) Bottom: Actinobacteria (left), Cyanobacteria (right) |