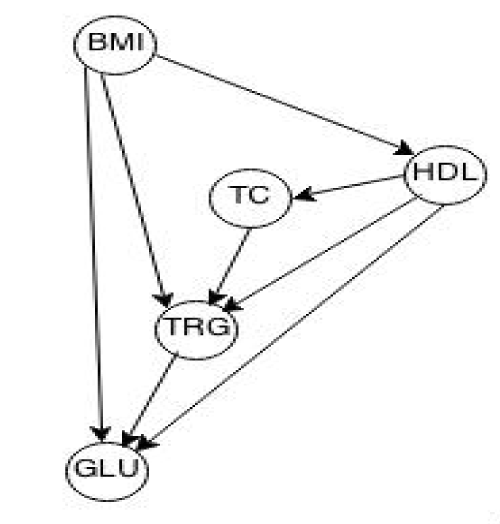
Figure 1:
The estimated causal graph across the entire sample set.