|
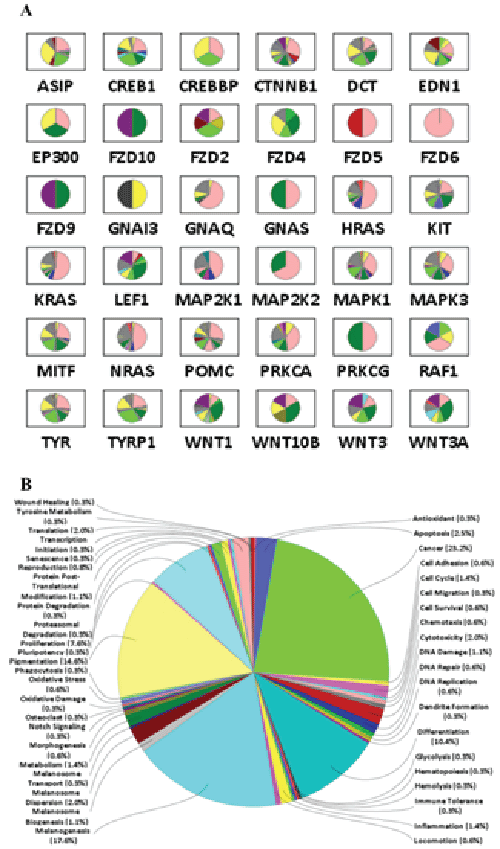
| Figure 4: Consolidated representation of the association of queried genes to processes. Panel A: Pie charts showing queried genes and their participation in processes. Each section in a chart refers to a unique process. Panel B: Pie chart corresponding to TYR gene. Processes and percentage of the total articles found by BioGyan are shown. |