 |
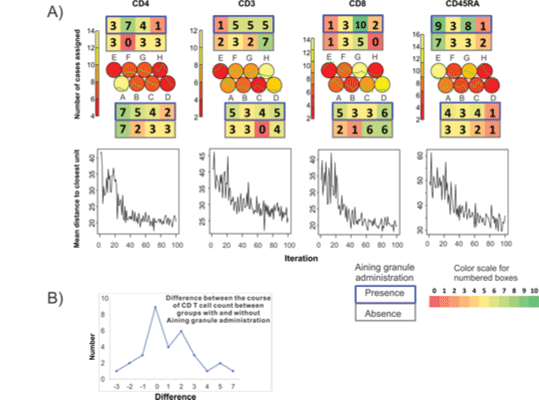
| Figure 1: Change of CD4, CD3, CD8 and CD45RA T cell count over an 11-month period during receiving HAART with and without Aining granule administration. A) Upper panel: Prototypic CD T cell course and the number of cases assigned. The prototypes are named A to H in specific CD T cell count to facilitate discussion. The numbers in colored boxes above and below each prototype represent the number of cases belonged to a particular prototype for the cases with (above) and without (below) Aining granule administration. Lower panel: Convergence was attained at about the 60th iteration for most cases. B) The difference between the course of CD T cell count between groups with and without Aining granule administration. |