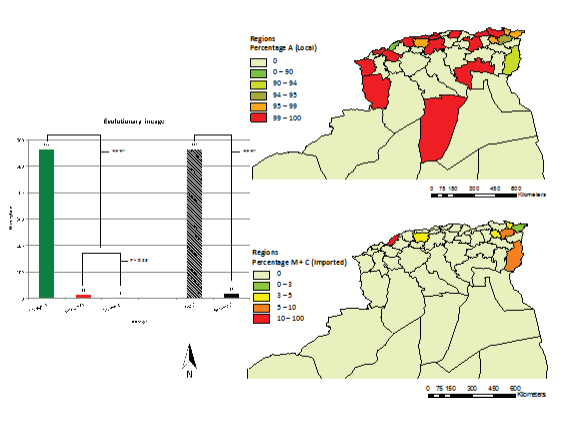
Figure 2:
ArcGIS maps of the percentage of mtDNA haplotypes detected in the 22 studied regions of Algeria, revealing two significantly distinct groups: local haplotype A, and imported haplotypes M and C (*** means P < 0.001 in paired t-test).