 |
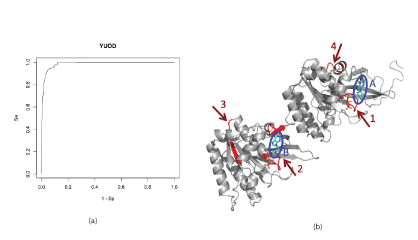
| Figure 6: (a) ROC curve associated with the probability of having YUOD for a given seven AA fragment (Se=sensitivity, Sp=specificity). (b) 3D representation of 2gbl A co-crystallized with two ATP molecules (indicated by lettered circles).The fragments identified as YUOD are indicated with numbered arrows. |