 |
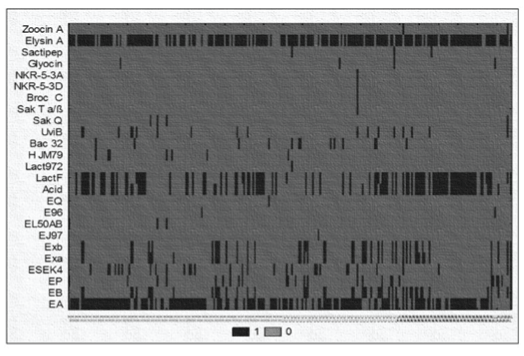
| Figure 3: Raw discrete data plot performed with Statistica 10.0 software.Each data point in this plot is represented as a rectangular region with twodifferent colors, black or grey, that correspond to the 1 or 0 values whichindicate the presence or absence of bac genes for each of the E. faeciumgenomes classified as animal (AN); human (H); food (F) sources and strainswith unknown provenience (U) depending on the origin of isolation of thestrains. Values within each series are presented along the x-axis, with eachseries plotted along the y-axis. Bacteriocin genes identified: enterocinA (EA), enterocin B (EB), enterocin P (EP), enterocin SE-K4 (ESEK4),enterocin Xα (Exa), enterocin Xβ (Exb), enterocin EJ97 (EJ97), enterocinL50A_B (EL50AB), enterocin 96 (E96), enterocin Q (EQ), acidocin LF221BgassericinK7B(Acid), lactacin_F subunit (LacF), lactococcin 972 (Lac972),hiracin JM79 (HJM79), bac 32, uvicin B (UviB), sakacin Q (SakQ), sakacin Tα/β (Sak a/b), brococin C (BroC), enterocin NKR-5-3D, enterocin NKR-5-3A,glyocin, sactipeptides (Sactipep), enterolysin A (Elysin A), zoocin A. |