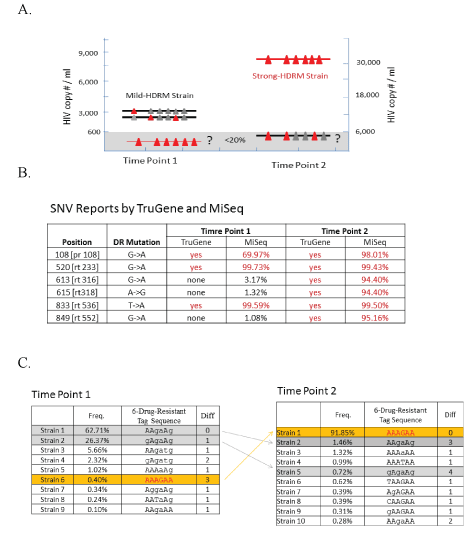
A. Plot illustration of hypothesis of the potential HDRM changes across two time points. The triangle in red denotes drug resistance mutation at the position, and the one in black is wildtype. The gray area means the <20% frequency area that is below the detection sensitivity of traditional Sanger based TruGene sequencing. The question is whether the HDRM seen existed in the time point 1.
B. The SNV-analysis results are derived from TruGene and MiSeq. MiSeq is able to detect 3 additional mutations (613, 615 and 846) with lower frequencies around ~ 1% in the time point 1. The HDRM seem to exist in very low frequencies, but without confidence, because the frequencies are at the boundary of MiSeq detection sensitivity.
C. The quasispecies-level analysis of the HIV population was done based on PacBio datasets for the two time points. The positions of 6 drug resistance mutations are selected into the tag panel. The tag-sequences show that HDRM clearly exist at very low frequency in the time point 1, and becomes the dominant quasispecies in the time point 2. Of note, the table lists all potential quasispecies. The tag-sequences with difference value <2 and frequency <0.4% should be considered as noise.