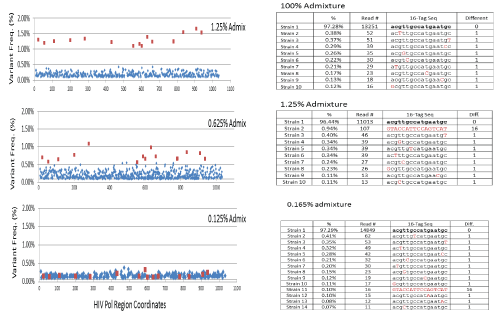
A. The SNV plots derived from MiSeq SNV analysis on benchmark admixture samples of 1.25%, 0.625% and 0.125%. The background noise (in blue) is in general low level (<1%). The expected 16 SNVs (in red) are well separated from background for the 1.25% benchmark sample. The separation of signal (in red) and noise (in blue) start to be blurred on the 0.625% benchmark sample, and finally lost on the 0.125% benchmark sample.
B. The tag sequences derived from PacBio’s quasispecies analysis on the same benchmark samples using the 16 SNVs at a tag panel. After the positions of 16 expected SNVs were selected into tag panel (signature) to construct artificial tag-sequence representing, the quasispecies profile is simply presented by the tag-sequences. For the tag-sequence, the lower case letter in black denotes wildtype (wt) nucleotide of the position. The upper case letter in red denotes a mutation of the position. The column of ‘difference’ values is to measure the number of mutations co-occurring on the same quasispecies by comparing it to the most frequent tag-sequence. According to the co-occurrence concept illustrated, the tag sequences with the difference number <2 and frequency <0.4% should be considered as noise or unconfident records. With these criteria, the minor quasispecies can easily stand out in the 0.165% admixture sample (Figure 3).