 |
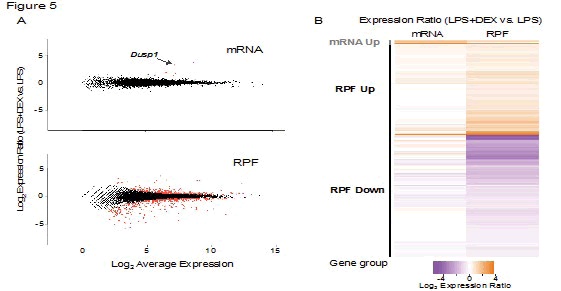
| (A) M-A plots for mRNA and RNA expression changes are shown. Differentially regulated genes (FDR < 0.05) are colored in red. A well-known gene, Dusp1, responding to DEX stimuli is indicated in mRNA. (B) Expression patterns in mRNA or RPF are clustered focusing on differentially regulated genes either in transcript (mRNA Up) or translation (RPF Up or Down) by comparing LPS and LPS + DEX (i.e., upregulation refers increased expression in LPS + DEX compared to LPS). |
| Figure 5: Differences between LPS- and LPS + DEX-stimulation were predominated by translation changes. |