 |
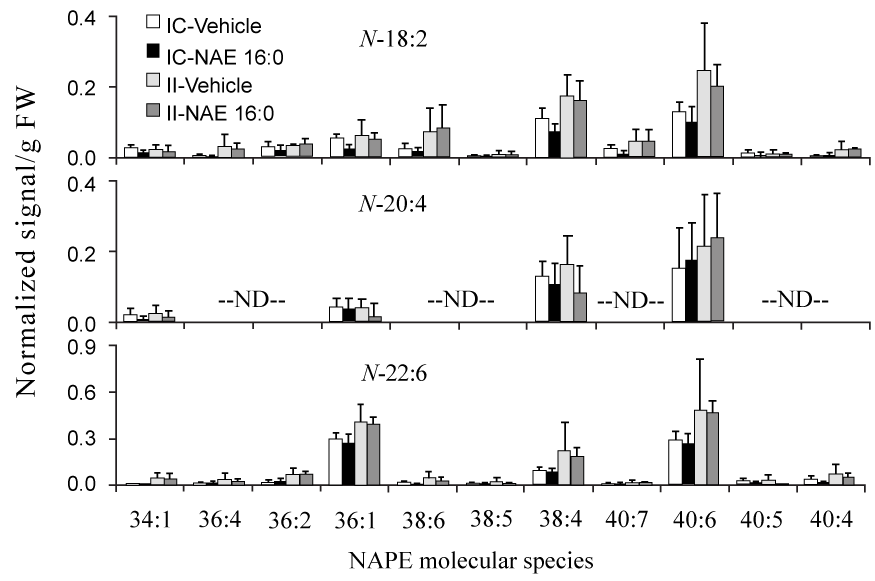
| Figure 5: Comprehensive analysis of ischemia/reperfusion-induced levels of NAPE molecular species with acyl chains N-18:2, N-20:4, and N-22:6, in contralateral (IC) and ipsilateral (II) brain tissue of groups treated with vehicle or exogenous NAE 16:0. Data are shown as mean ± SD and N = 4. NAPE molecular species labels indicate the diacyl component (total acyl carbons: total carbon-carbon double bonds) of each detected NAPE species. “ND” indicates molecular species that were not determined (see Experimental Procedures). NAPE species mass spectral signals were normalized against the signal, assigned to be 1 unit, observed for 1 nmol of the internal standard, N-17:0 di16:0 PE. |