|
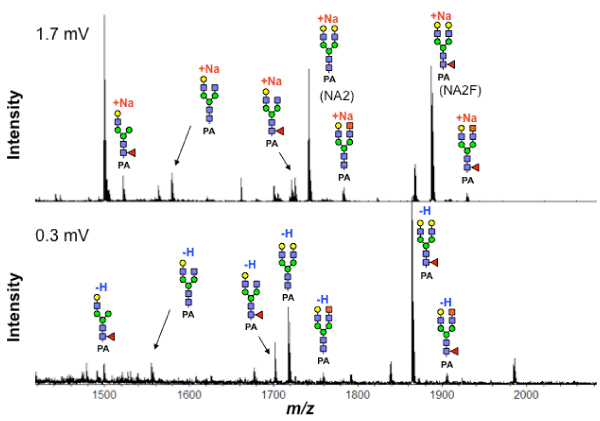
| Figure 1: MS spectra of PA-glycans obtained by MALDI-QIT-TOF MS. Glycans labeled with PA were detected as the [M+Na]+ or [M-H]- ions by MALDI-QIT-TOF MS. The MS spectra in positive (upper) and negative (lower) ions are shown. The schematic glycan structures are denoted for each signal in the chart. N-acetylglucosamine, Mannose, Fuc, Galactose and GalNAc are indicated as blue squares, green circles, red triangles yellow squares and orange squares, respectively. |