 |
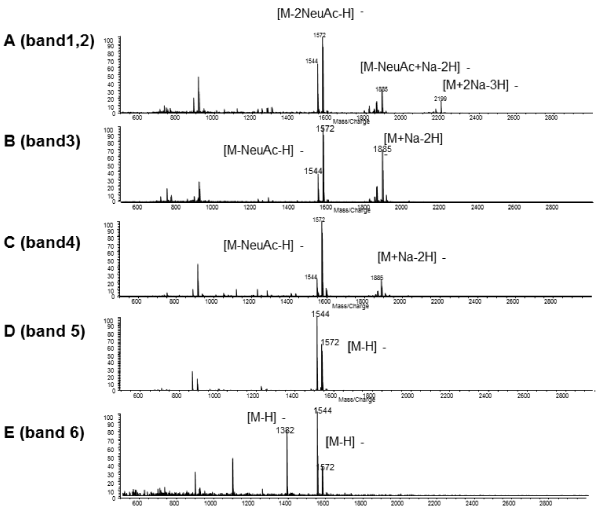
| Figure 2: TLC-Blot/MALDI-QIT-TOF MS spectra of bands 1 to 6. The transferred lipids on the membrane were analyzed by MALDI-TOF MS in negative mode. A, bands 1and 2 (corresponding to GT1b); B, band 3 (GD1b); C, band 4(GD1a); D, band 5(GM1) and E, band 6(corresponding GM1and GM2). |