 |
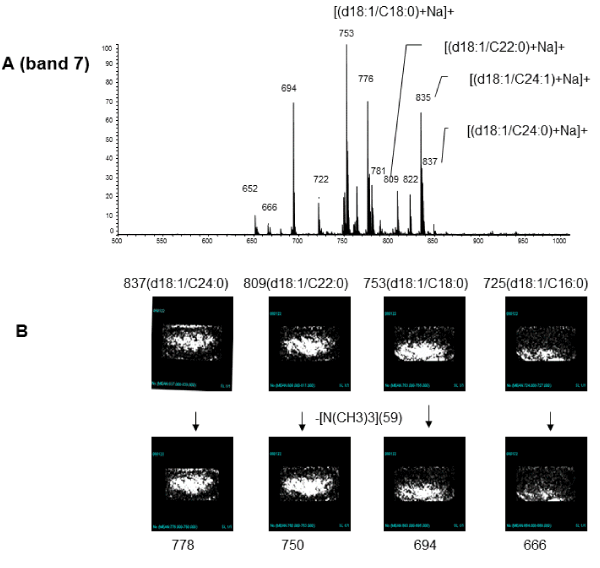
| Figure 3: TLC-Blot-MALDI-QIT-TOF MS spectra bands 7. The spectrum was obtained by MALDI-TOF MS in positive mode. A, Spectrum of band 7 corresponding to SM. B, The ions of major SM molecular species and their fragment ions which are appeared by the reduction of the trimethylamine [-N(CH3)3] from individual parental ions. These ions were scanned and their imaging profiles are shown. |