 |
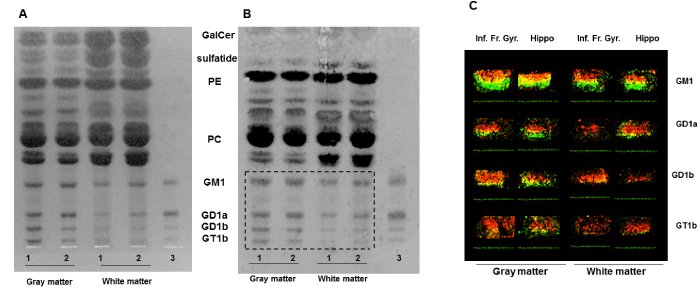
| Figure 6: TLC-Blot of human brain lipids and ganglioside imaging of their molecular species. A, TLC of the lipids from gray matter and white matter extracted from normal human inferior frontal gyrus (1) and hippocampus (2). The bovine ganglioside standard was applied for reference (3). B, TLC-Blot of the lipids separated by TLC (the lipids transferred to the membrane were visualized with the primuline reagent). C, Ion imaging of the major molecular ions (m/z 1544 (green) and m/z 1572 (red)) of GM1, GD1a, GD1b and GT1b. |