 |
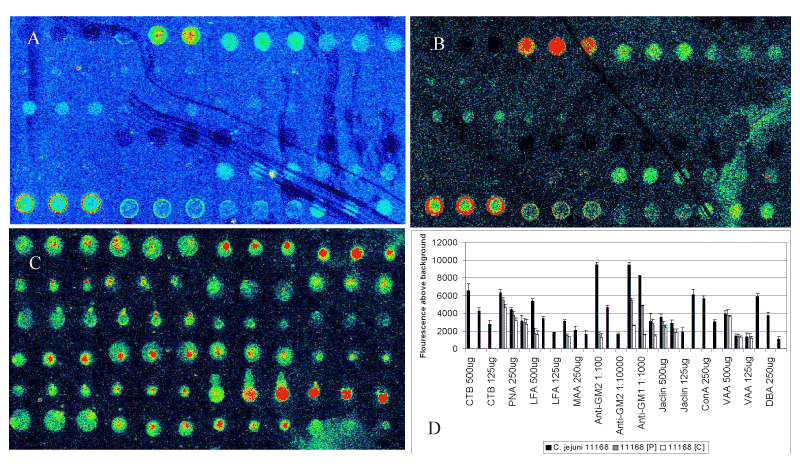
| Figure 3: Analysis of live C. jejuni 11168 compared to purified LOS. A). Lectin array analysis of crude LOS extract prepared from C. jejuni 11168. B). Lectin array analysis of phenol purified LOS extract prepared from C. jejuni 11168. C). Lectin array analysis of live C. jejuni 11168. D). Graphical representation of the array analysis. Error bars equal one standard error of the mean. Any data not significantly different from background has been set to zero units. Lectins are listed in Table 2. |