 |
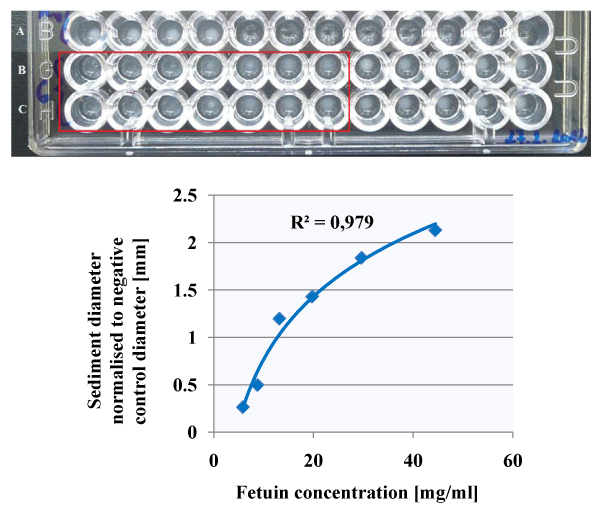
| Figure 3: Interaction of IBs with sialylated protein fetuin. Line A – negative control (no fetuin); lines B, C – interaction of 50 μl IBs with 1,5-fold diluted fetuin (66,67 mg/ml) in 25 μl PBS (final concentration 22,22 mg/ml in well) from column 1 to 12; red frame – positive interaction. Diagram represents logarithmic regression between sediment diameter and fetuin concentration. |