 |
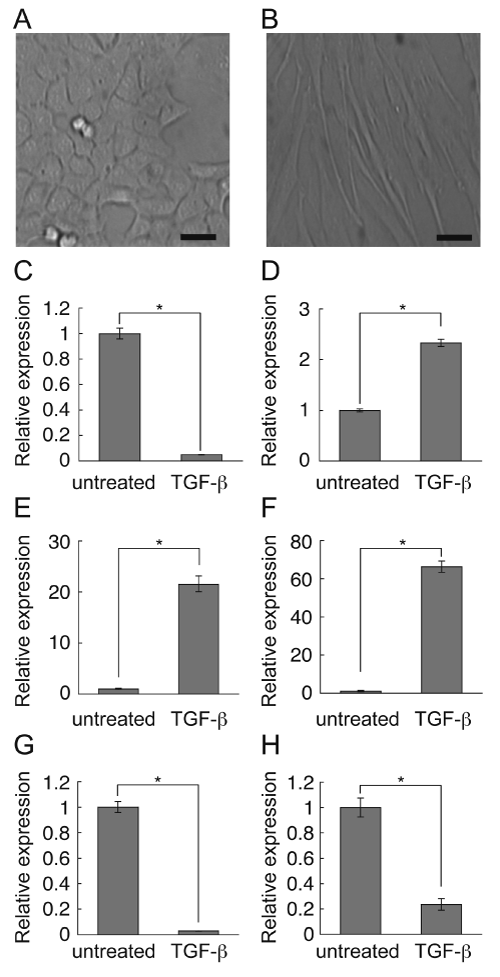
| Figure 1: Downmodulation of heparanase expression in NMuMG cells undergoing EMT. NMuMG cells were cultured with 1 ng/ml of TGF-β3 for 48 h. (A) Untreated cells having cobblestone-type shape, (B) TGF-β3-treated cells having spindle-type shape. Scale bar indicates 25 μm. (C-G) mRNA expression of E-cadherin (C), N-cadherin (D), MMP-2 (E), MMP-9 (F) and heparanase (G) in NMuMG cells. The values are normalized to β-actin expression. (H) Protein expression of heparanase as detected by ELISA. The heparanase content was 36 ng/ml (untreated) and 9 ng/ml (TGF-β3-treated) respectively. *p<0.01. |