 |
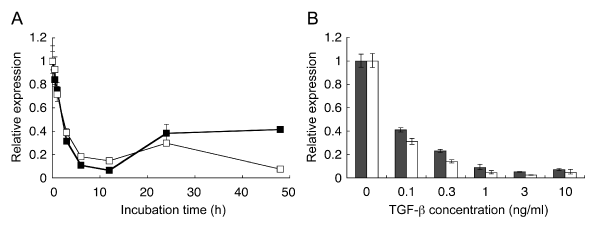
| Figure 3: Kinetics and dose dependence of heparanase mRNA downmodulation. mRNA expression of heparanase and E-cadherin was examined under varied conditions. (A) NMuMG cells were cultured with 1 ng/ml TGF-β3 for different time periods. Closed and open squares indicate E-cadherin and heparanase, respectively. (B) NMuMG cells were cultured with different concentrations of TGF-β3 for 48 h. Closed and open bars indicate E-cadherin and heparanase, respectively. |