|
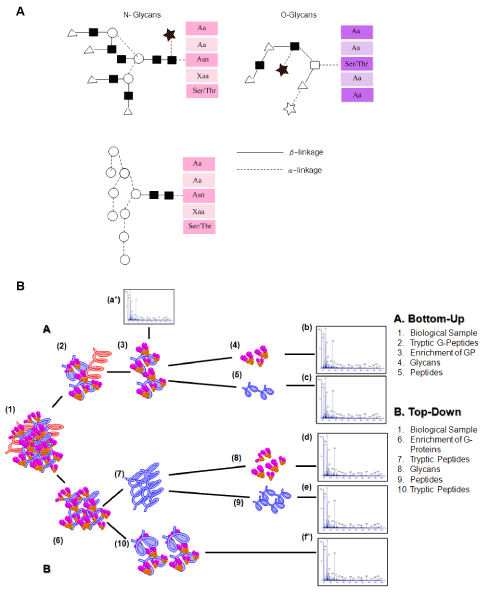
| Figure 4: N-Glycans and O-glycans spectra. B). Pipeline of glycoproteomics analysis A shows the Bottom Up pipeline and B the Top Down. The analysis from (a) to (f) is the Mass Spectrometric Spectra of Peptides or Glycans. (a*) and (f*) keep information of glycoproteomics. |