 |
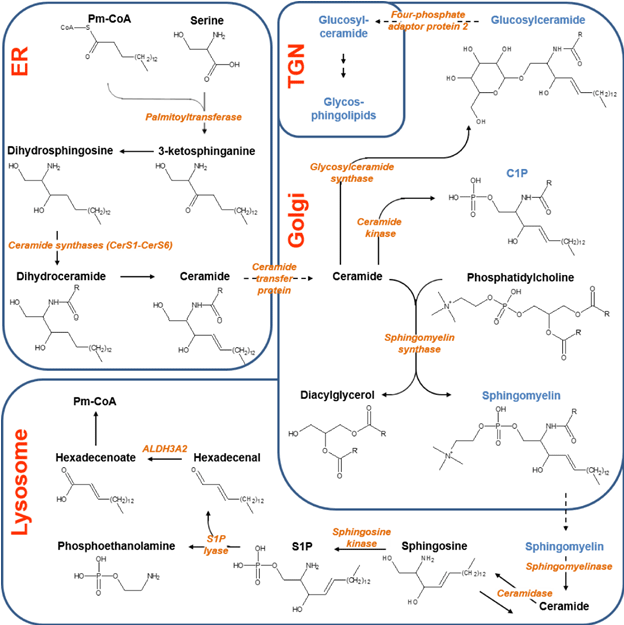
| Figure 2: Sphingolipid metabolisms. Sphingolipids are shown in blue; substrates and by-products for Sphingolipids metabolism are shown in black; and all important enzymes are shown in orange. Biochemical reactions are represented by solid arrows, and inter-organelle transportations are represented with dashed arrows. R and R’ in represent possible functional groups derived from fatty acid. Abbreviations: ALDH3A2, fatty aldehyde dehydrogenase; C1P, ceramide-1-phosphate; ER endothelium reticulum; Pm-CoA, palmitoyl coenzyme A; S1P, sphingosine-1-phosphate; and TGN, trans-Golgi network. |