|
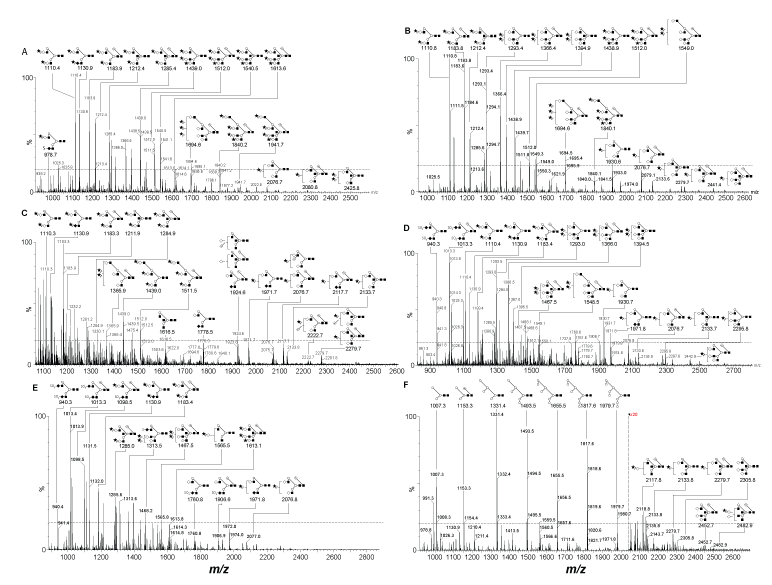
| Figure 2: Negative mode nano-ESI mass spectrometry of oligosaccharides released from reduced, carboxymethylated hFSH samples by peptide-N-glycanase F digestion. Structures of the more abundant glycans are shown for each preparation along with the monoisotopic m/z value. Because the 13C ion is often more abundant than the former, peaks may be labeled with m/z values that do not match values found in Table 1. A. Glycans from pituitary hFSH preparation AFP7298A. B. Glycans from purified urinary hFSH. C. Glycans from recombinant GH3-hFSH. D. Glycans from hFSH24 glycoform preparation. E. Glycans from hFSH21 glycoform preparation. F. Glycans from hypo-glycosylated hFSH21/18 preparation isolated from highly purified hLH preparations. Note the expanded scale indicated by the dashed line. |