 |
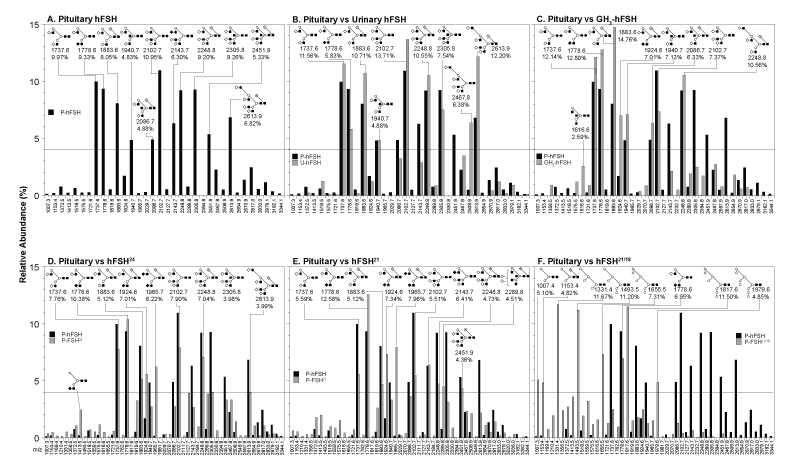
| Figure 6: Comparison of glycan abundance by neutral core structure. The abundances of all variants sharing a common core were summed and plotted. Comparisons were made between highly purified pituitary hFSH glycans and those of the other five preparations analyzed in this study. A. Purified pituitary hFSH glycans, showing the glycan families accounting for at least 4% of the total. B. Comparison of urinary with pituitary hFSH glycans. The structures in this and subsequent panels represent urinary glycans, as pituitary glycans were shown in panel A, above. C. Comparison of recombinant GH3-hFSH with pituitary hFSH glycans. D. Comparison of hFSH24 with pituitary hFSH glycans. E. Comparison of hFSH24 with pituitary hFSH glycans. F. Comparison of hypo-glycosylated hFSH21/18 with pituitary hFSH glycans. The solid bars represent the hFSH glycan families while the gray bars represent the other hFSH preparation glycans. |