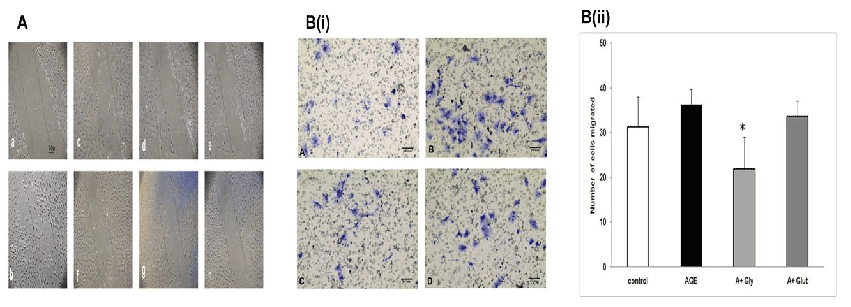
A: (Scratch assay)
a: Control (untreated), b: AGE (100 μg/ml) treated c-e : Glycine (0.5,1 and 2.5 mM)+AGE, f-h: Glutamic acid (0.5,1 and 2.5 mM)+AGE (100 μg/ml),There is inhibition of migration by both the amino acids.
B: Transwell migration assay:
B (i) A: control (untreated), B: AGE (100 μg/ml) treated C: Glycine (2.5 mM)+AGE, d: Glutamic acid (2.5 mM)+AGE.
B (ii) Bar graph of the cells counted in transwell assay is represented here and there was a significant inhibition of migration by glycine.