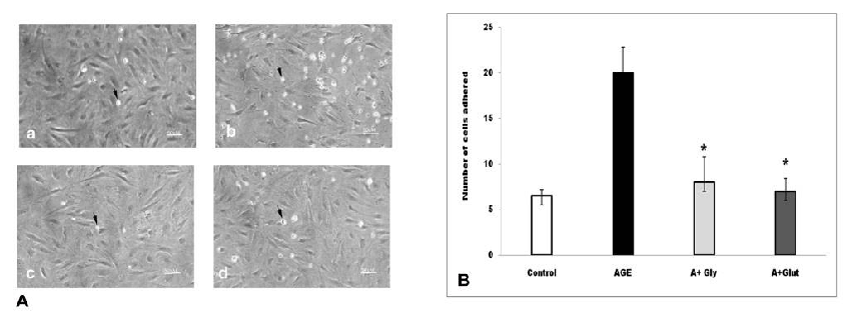
A: a: control (untreated), b: AGE (100 μg/ml) treated c: Glycine (2.5 mM)+AGE (100 μg/ml), d: Glutamic acid (2.5 mM)+AGE (100 μg/ml).
The figure shows there is an increased adhesion of PBMC to endothelial cells when treated with AGE compared to control (Mononuclear cells are indicated with an arrow). There was a 50% decrease with treatment with amino acids glycine and glutamic acid at 2.5 mM concentration.
B: The number of cells adhered were counted in three different fields and plotted as a bar graph.