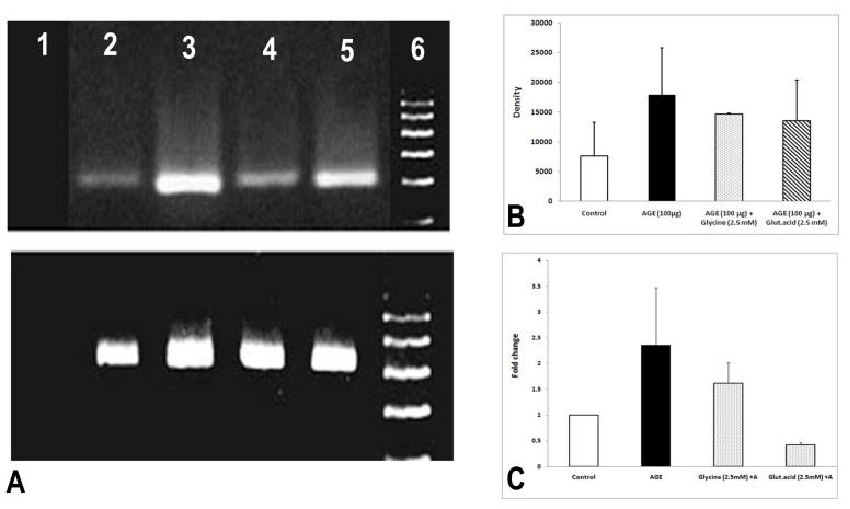
A: VEGF RTPCR.
Lane 1: Negative control Lane 2: control, Lane 3: AGE (100 μg/ml), Lane 4: Glycine 2.5 mM+AGE (100 μg/ml), Lane 5: Glutamic acid 2.5 mM+AGE (100 μg/ml), Lane 6: DNA Ladder 600 bp. GAPDH was also run as a house keeping gene for the same.
B: The densitometric representation of the RTPCR gel normalized to GAPDH.
C: Real time PCR for VEGF mRNA expression is represented as a bar graph keeping control (untreated) as 1.