 |
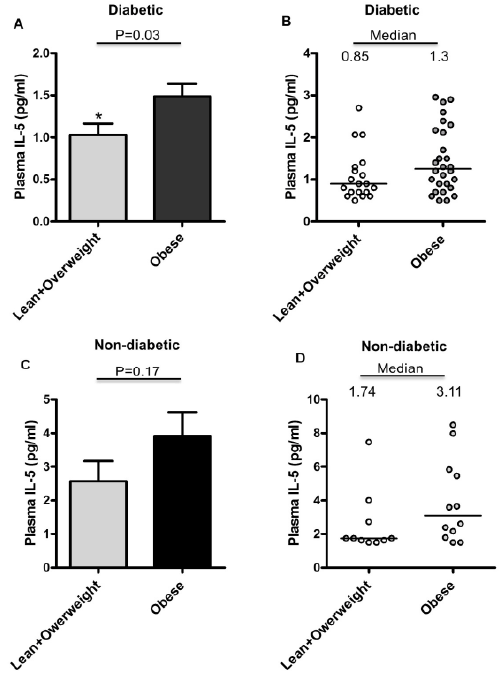
| Figure 2: Plasma samples from 43 diabetic and 22 non-diabetic individuals were analyzed for the expression of IL-5 using Luminex magnetic bead assay. The diabetic and non-diabetic group, each, was classified on the basis of body mass index (BMI) as described in Materials and Methods. (A) IL-5 levels (mean±SD) are shown for obese diabetic and overweight/lean diabetic individuals. (B). Dot plot of IL-5 levels is shown for obese diabetic and overweight/lean diabetic subjects. Each dot represents the individual value of IL-5 and the lines represent median values of plasma IL-5 in each group. (C) IL-5 levels (mean±SD) are shown for obese non-diabetic and overweight/lean non-diabetic individuals. (D). Dot plot of IL-5 levels shown for obese non-diabetic and overweight/lean nondiabetic subjects. Each dot represents the individual value of IL-5 and the lines represent median values of plasma IL-5 in each group. |