 |
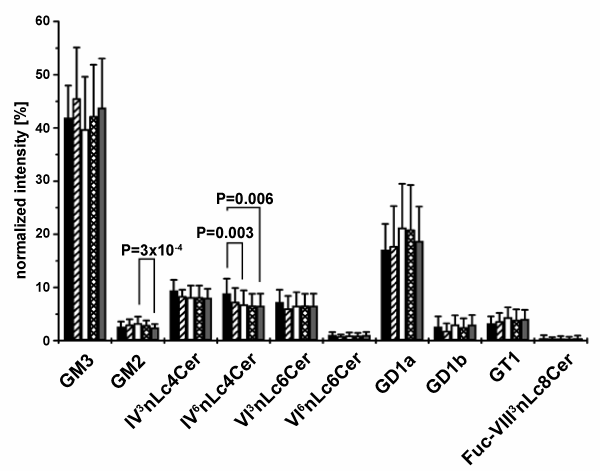
| Figure 3: Normalized serum ganglioside levels of ten most abundant ganglioside glycoforms. Mean values and standard deviations refer to the sum of monitored ganglioside signals among each glycoform. Patient groups are represented by the columns as follows: pancreatic cancer (black), benign pancreatic diseases (striped), non-diseased controls (white), benign gastric diseases (checked), gastric cancer (grey). |