 |
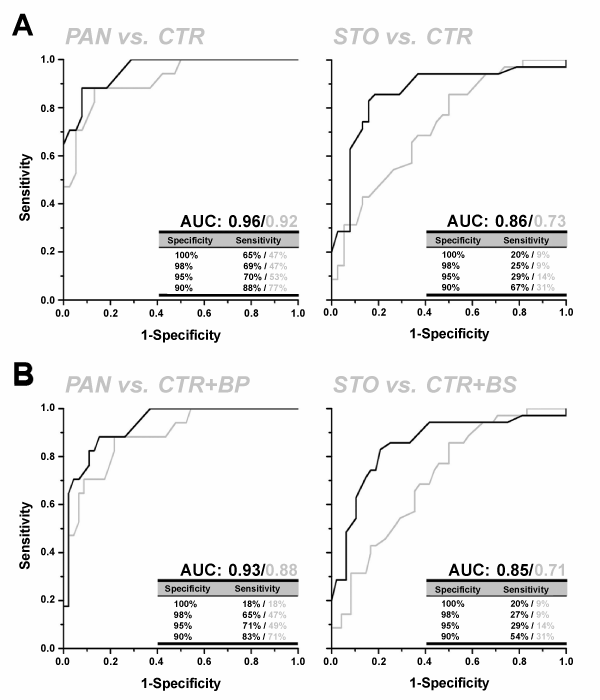
| Figure 5: ROC-curves for identification of pancreatic and gastric cancer patients based on GM2-and GD1a-related ceramide ratios. (A) ROC-plots for identification of pancreatic (PAN) or gastric cancer patients (STO) combined in data sets with non-diseased controls (CTR). (B) ROC-curves for identification of pancreatic or gastric cancer patients combined in data sets with non-diseased controls and patient cohorts suffering from benign diseases of the pancreas (BP) and the stomach (BS), respectively. Curves were calculated for GM2-(black lines) and GD1a-related CerC16:0/CerC18:0 ratios (grey lines). |