 |
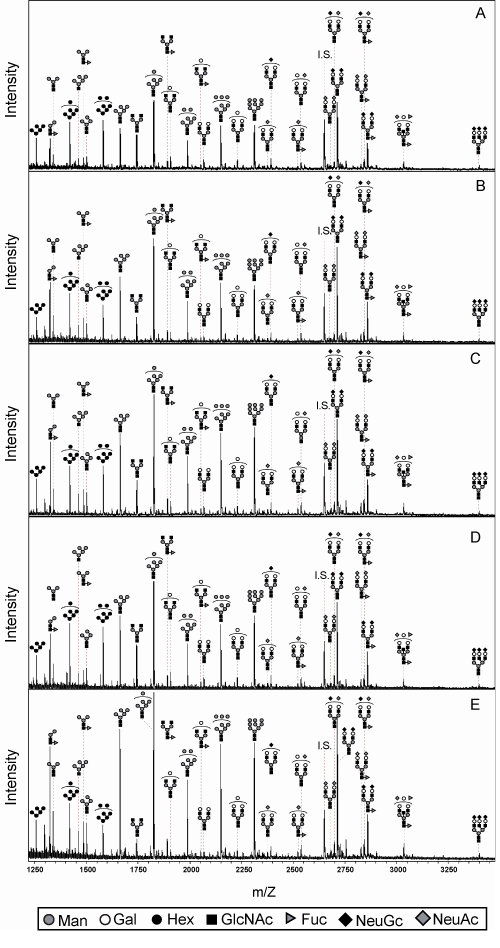
| Figure 1: Structural characterization of N-glycans during the mouse estrous cycle, immature (A), early follicular phase (B), middle follicular phase (C), ovulation phase (D), and luteinization phase (E). The intensities of the N-glycan ms spectra were compared with A2 amide as an artificial glycan (as internal standard; I.S.). |