|
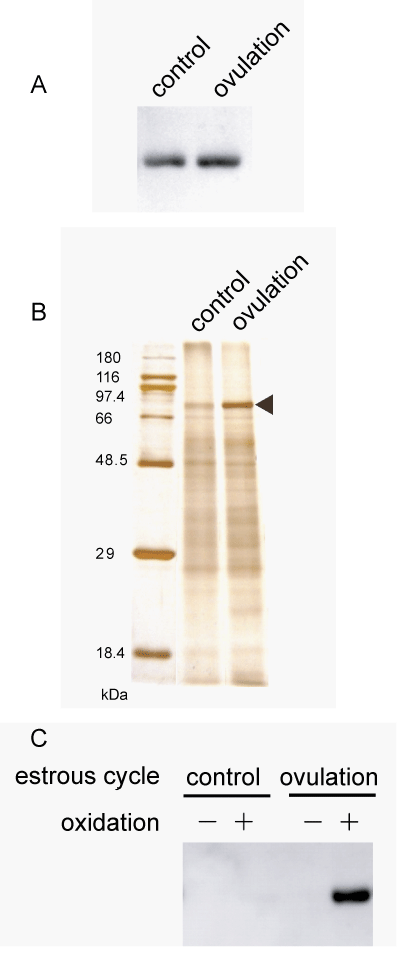
| Figure 3: Detection of transferrin in control and ovulation phase. (A) Each lane was loaded with the equivalent of 50 μg of homogenates. The same amount of transferrin in crude extracts was detected by western blot analysis using an anti-transferrin antibody. (B) After performing the modified protocol, collected sialoglycoproteins were separated by SDS-PAGE and the band (80KDa) was visualized by silver staining. (C) With the modified protocol, the band was confirmed to be transferrin by western blot analysis using the anti-transferrin antibody under oxidation conditions (+/-). |